In the seventh week of WATS 4010 our cohort at Seattle University studied how to mine user data using Google Analytics. Although this blog has been tracked by Google since the beginning of this quarter, the number of people viewing the site is still pretty small. Still, with some data you can view your website statistics and begin to understand how Google uses the personal data they collect from email accounts to create a profile of your viewers. Google also tracks how users navigate a website, how long they stay on any particular page, and if they click on anything.
I am personally not comfortable with the mining of personal information for marketing or advertising purposes, but marketing is not my focus. I wish to build websites that are easy to use, intuitive, and fast to navigate. I will be showing how Google Analytics can inform how users are navigating your website, how they might be missing landmarks, and what jumps out at them. If a user ends up spending time on a page that you assume they will move on from quite quickly, this can be a red flag that the page is not well designed.
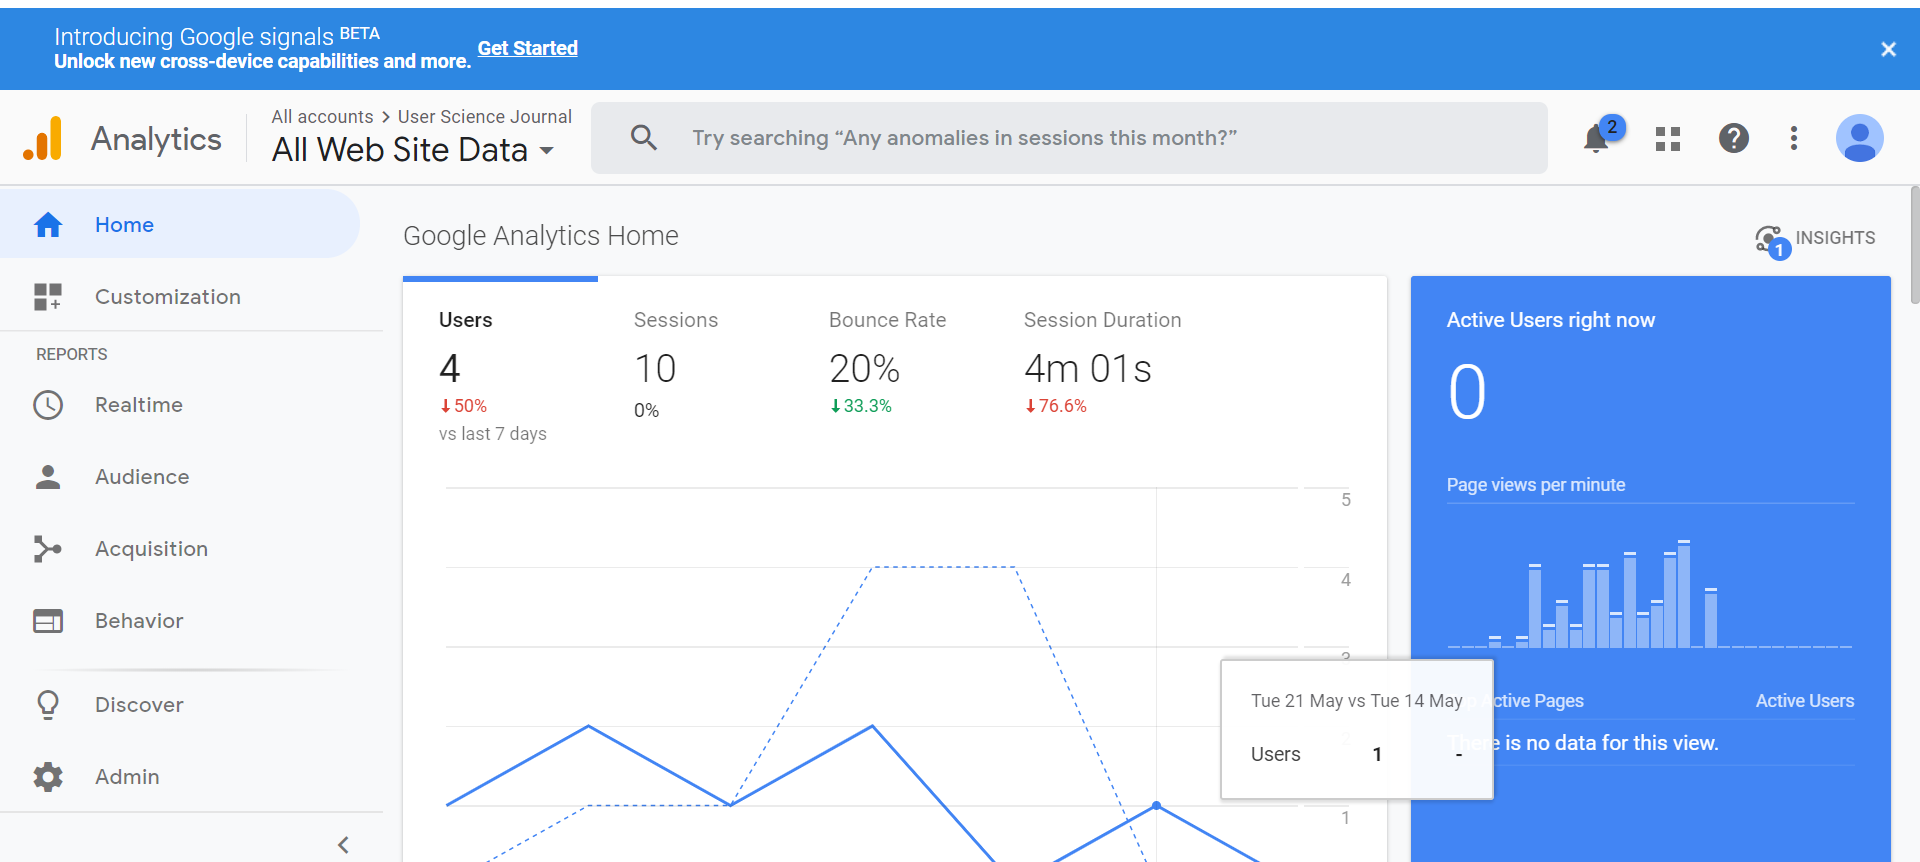
Setting up Google Analytics on your website is a simple process. Follow the link on my home page to register your website and get a tracking code to add to a script statement in the header of each page you wish to track. Once installed and configured, Google will begin to collect data. The home page of Google Analytics is shown below.

The left side menu on the home page includes the following: Customization, the five report sections titled Realtime, Audience, Acquisition, Behavior, and Conversions, a tutorial section titled Discover, and Admin.
Realtime allows you to see what is happening on your website right now, who is on your site, where they came from and what they are clicking on. Audience gives more information about your visitors but you have to ask Google to collect this data, it is not on by default. Acquistion gives you more information about how users came to your site, and Behavior gives a thorough reporting of how users have navigated, not in realtime, but over time. Conversions deals with marketing and e-commerce goals and whether they are being met.
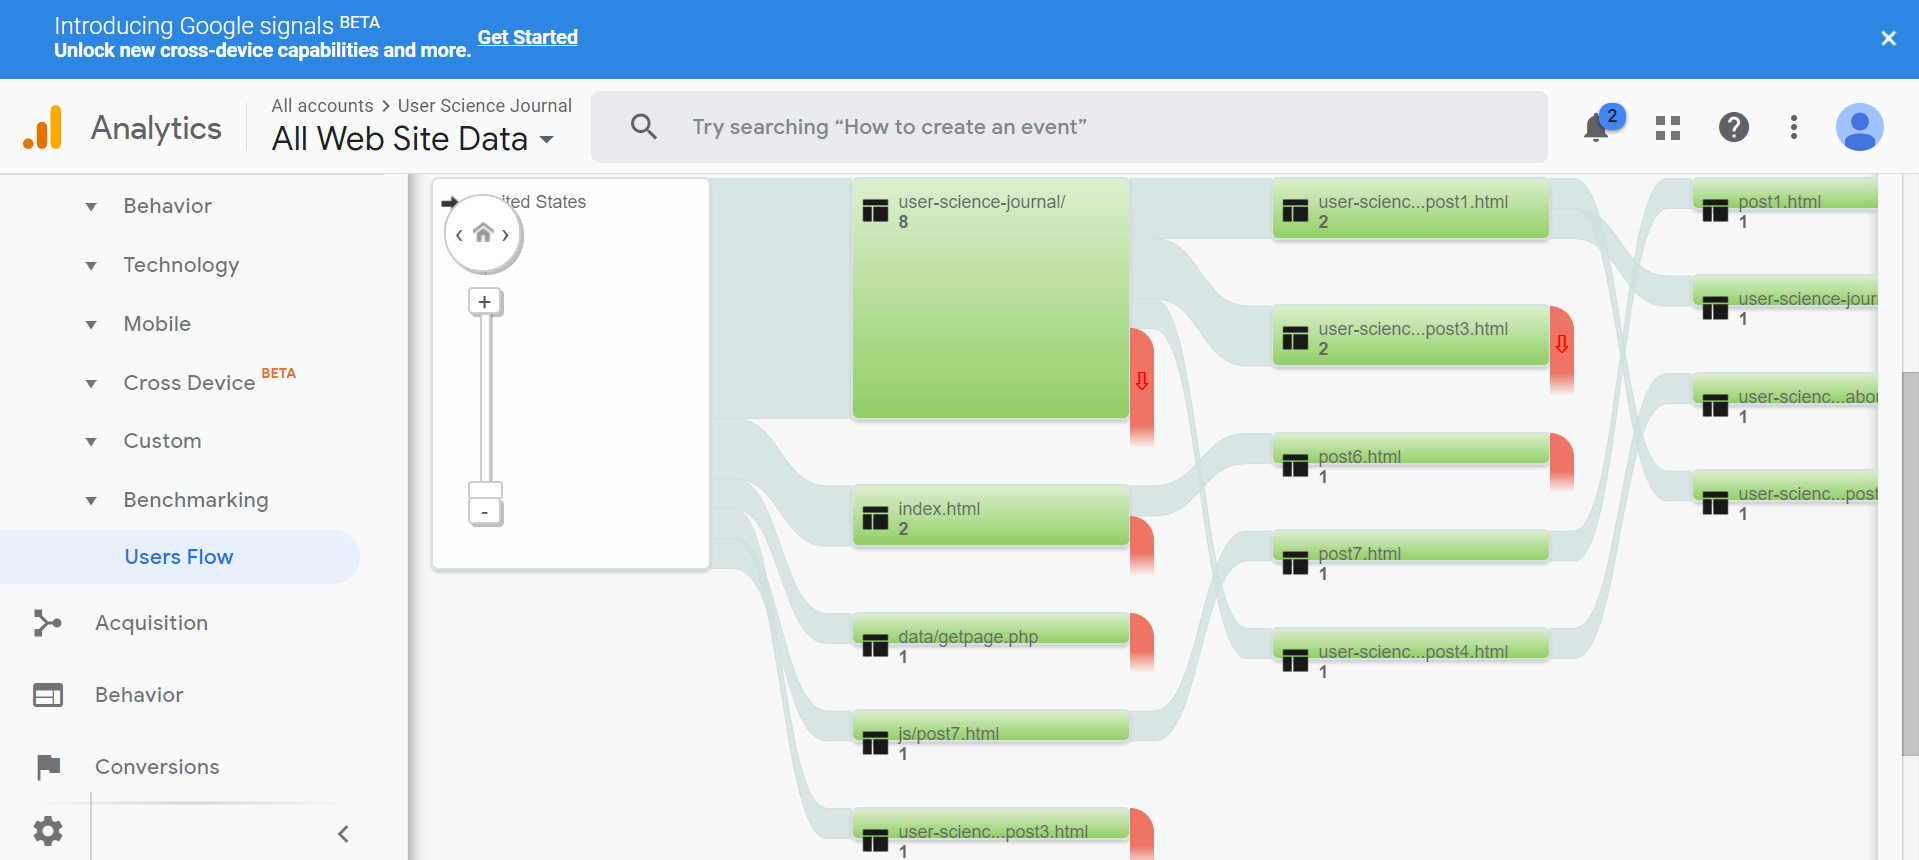
Because my interest is in designing websites and visuals, I am drawn to how well Google' design team has made it easy for people using their software to understand their own website traffic with stunning visual charts. Below is a example of one of these visuals, this one lets you see how your user is navigating the website, page by page. My website viewers are mostly me at this point,but I can see how this chart changes as I move through my website again.

In my next post I will explore setting up custom events on your website that will be triggered by button click and tracked by Google Analytics.
Resources:
Krug, Steve. Don't Make Me Think, Revisited : a Common Sense Approach to Web Usability. [Berkeley, Calif.] :New Riders, 2014.
Google Analytics Link here
Google. Tools for Developers. Lighthouse. Web. 2019. Lighthouse link.
webaim.org. WAVE. Web. 2019. WAVE link